Honoring heritage and reuniting families

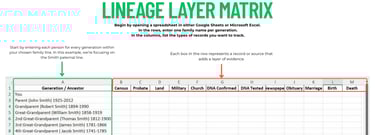
Lineage Layers: A Visual Matrix for Smarter Genealogy Research
Your family tree may appear complete, but how strong is the evidence holding it all together? The Lineage Layers Method is here to change the way you research! This systemic approach goes beyond simply listing names and dates. It helps you organize your work by showing exactly which records you’ve found for each generation and where the missing pieces still are. It’s a game-changing way to turn your tree into a well-documented, rock-solid piece of family history.
Aimee Rose-Haynes
7/2/20253 min read
🔍 Are you tracing names but still missing the story?
Your family tree might appear complete, but how solid is the research behind each branch?
The Lineage Layers Method offers a fresh and effective way to organize your genealogy work. This approach goes beyond names and dates by helping you track which records you've found for each generation and where gaps still exist. The idea is to layer the records for your ancestor making the line stronger with the evidence which will give you a stronger and more accurate family tree.
By combining generational structure with record types like census, land, military, and DNA, you get a clear visual of your research progress. It highlights strong areas and reveals exactly where more digging is needed. Instead of wondering where to go next, you’ll have a focused plan for moving forward.
Whether you're just beginning your family history journey or revisiting years of past research, the Lineage Layers Method will help you stay organized, work more efficiently, and uncover the missing pieces in your family story.
✅ Step-by-Step Guide:
Step 1: Choose Your Focus Line
Pick one surname line or direct lineage (e.g., paternal grandfather's line).
For this example, we will do the Smith Paternal line.
Step 2: Create the Matrix
Set up a spreadsheet (or use the provided printable) with:
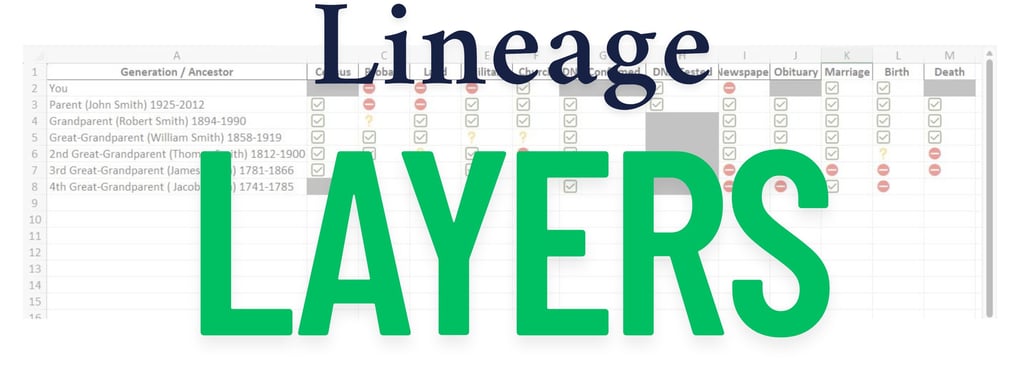
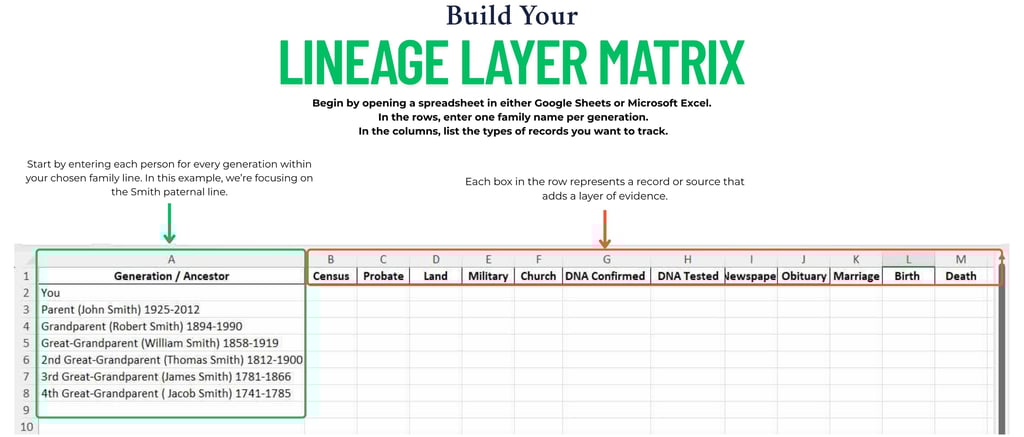
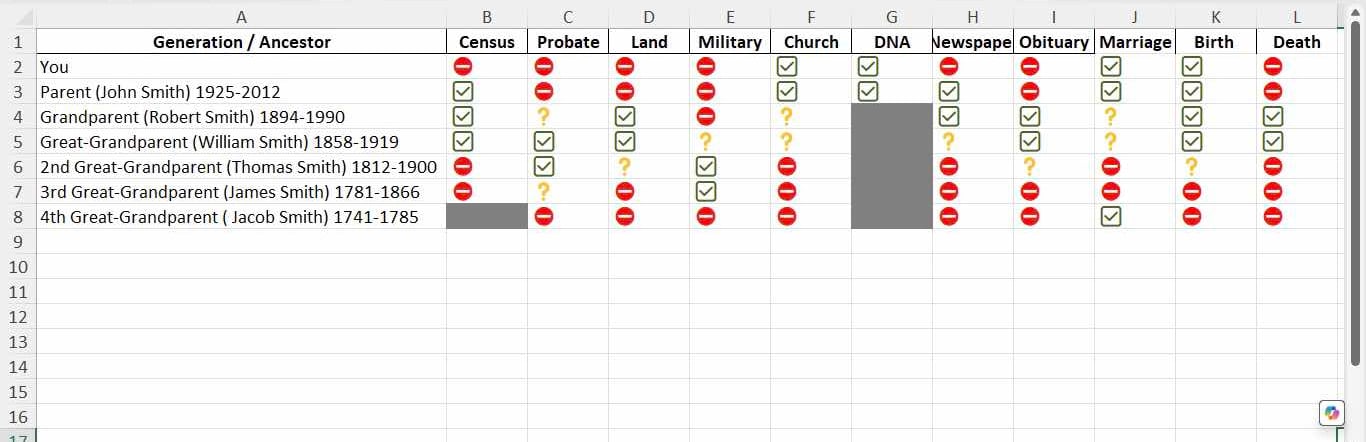
Rows = Generations (e.g., You, parents, grandparents… 5+ generations). I added the generation/relationship, their name, and birth/death dates if known.
Columns = Record Types (choose those most applicable, such as Census, Probate, Land, Military, Church, DNA, Obituary, Newspaper, etc.). You can customize this however you need to. You could add each Census year and document if you found your ancestor enumerated on every census record.
Step 3: Fill in the Matrix
For each ancestor and each record type, mark:
✅ for records located and sourced, no more research needed for this particular document or record type
? for partially found or questionable records, needs more research to confirm
⛔ or blank for no documentation yet, needs more research
⬛ for not applicable or not available, no research needed for this particular document or record type.
Use color coding to quickly visualize the strength of your documentation for each ancestor and record type:
🟩 Green = Confirmed and fully sourced
🟨 Orange= Partial, in progress, or needs review
🟥 Red = Missing or not yet found
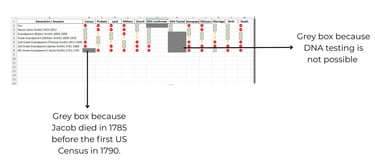
⬛ Gray = Not applicable (for example, no census records exist before 1790 in the U.S. for someone who died in 1785)
💡 Why Color-Coding Matters
Color coding transforms your research matrix into a powerful visual dashboard. Instead of scanning dozens of notes or check boxes, you can instantly spot:
Which generations are well-documented (rows with lots of green)
Which record types you've overlooked (columns with red or orange)
Where to prioritize your next research steps
It also helps track your progress over time. As you find new records or re-evaluate older ones, you can simply update the color. This makes your matrix a living, evolving part of your research strategy.
Step 4: Analyze the Matrix
Look for horizontal “holes” or red (generations with lots of missing sources)
Look for vertical gaps (record types you've overlooked, like land or newspapers)
Highlight ancestors with the weakest documentation for targeted research
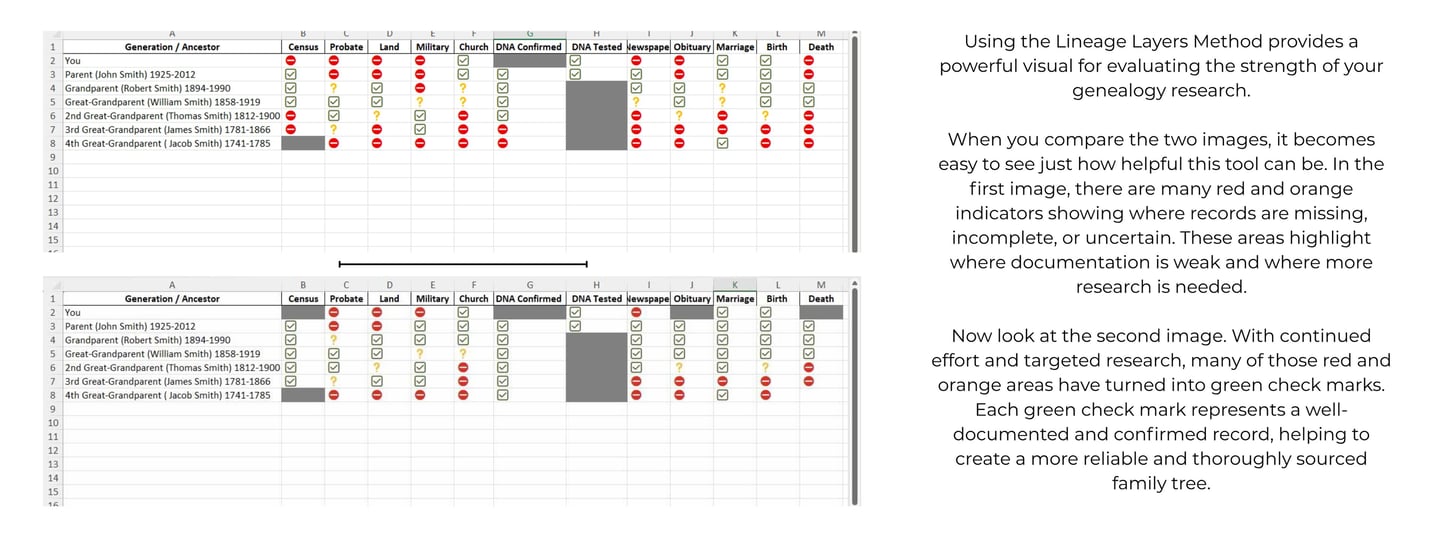
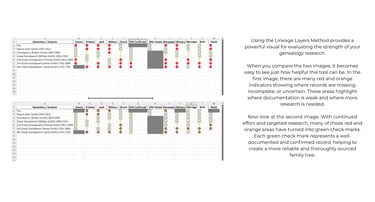
The image above makes it easy to identify where records are missing, helping me direct my research to those specific gaps. By layering in additional documentation, I can strengthen the foundation of each generation in my family tree. My goal is to increase the number of green check marks across every generation to ensure a more thoroughly sourced and reliable tree.

Final Thoughts
The Lineage Layers Method is more than just a chart. It offers a clear and practical way to visualize the strength of your family history research. This approach helps you track your progress, identify gaps in documentation, and stay focused on the records that need attention most. Instead of working from scattered notes or uncertain leads, you can follow a structured plan that brings direction and clarity to your next steps.
Whether you are beginning your genealogy journey or refining a tree you have been working on for years, this method gives you the tools to build a stronger, more complete, and well-documented family tree. Use the visual matrix to guide your research and turn uncertainty into discovery.